-
Your Questions, Our Answers
Q:What is going on with the gold/silver ratio? Since 2001, it peaked twice at 85 but now it just keeps going higher!
Back to the media page m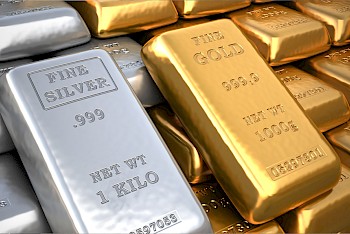 Answer: Gold and silver are thought by many to be in the final stages of completing a 30-year cycle relative to the US dollar. If the US dollar index double tops this summer, the gold/silver ratio could potentially also double top at around 100. The last time the ratio got this high was 1990, followed by a secular decline, bottoming in 2011 at 31, when gold and silver prices peaked during the last bull market for precious metals. In my view, the ratio could enter into secular decline as global currencies weaken due to a global economic slow down, higher debt loads, insolvent pension entitlements and continued political uncertainty. Over the next few years, the ratio could revert to low levels as the world sorts out the next global debt crisis and investors flock to gold and silver as safe haven assets.
Historically when both gold and silver were money, they were traded at around the 16:1 ratio. When the British Pound was the global reserve currency in the late 1800’s, it was fixed to gold and silver prices at a 16:1 ratio. After decades of adjusting currencies to the gold price, the USA finally allowed the US dollar to float against gold in 1971, which prompted investors to flock to gold and silver as real money and a hedge against hyper-inflation. By 1980, the gold/silver ratio once again reached 16:1. Over the last 100 years, silver has become more of an industrial metal and only when investors seek gold as a safe haven do they once again discover the monetary nature of silver. That is why it is known as the “poor mans gold”.

- Home
- About
- Portfolio
- Sustainability
- Investors
- News & Media
- Blog
- Contact
© 2024 Endeavour Silver Corp.
All rights reserved.
Cookies are used to make this website work and to enhance your experience. To learn more about the types of cookies this website uses, see our Cookie Policy. You can provide consent by clicking the "I Consent" button or by canceling this cookie notice.
Cookies are used to make this website work and to enhance your experience. To learn more about the types of cookies this website uses, see our Cookie Policy. We need your consent to use marketing cookies. Marketing cookies are used to track visitors across websites. The intention is to display ads (via third party services) that are relevant and engaging for individual users. Please select the checkbox below to indicate your consent.